
Using Moving Averages in Stock Analysis
Moving averages are among the most widely used tools in technical analysis. They help smooth out price data, filter out noise, and reveal the underlying trend of a stock. Whether you’re a beginner or experienced trader, understanding how to use moving averages can improve your stock analysis and trading decisions.
What Are Moving Averages?
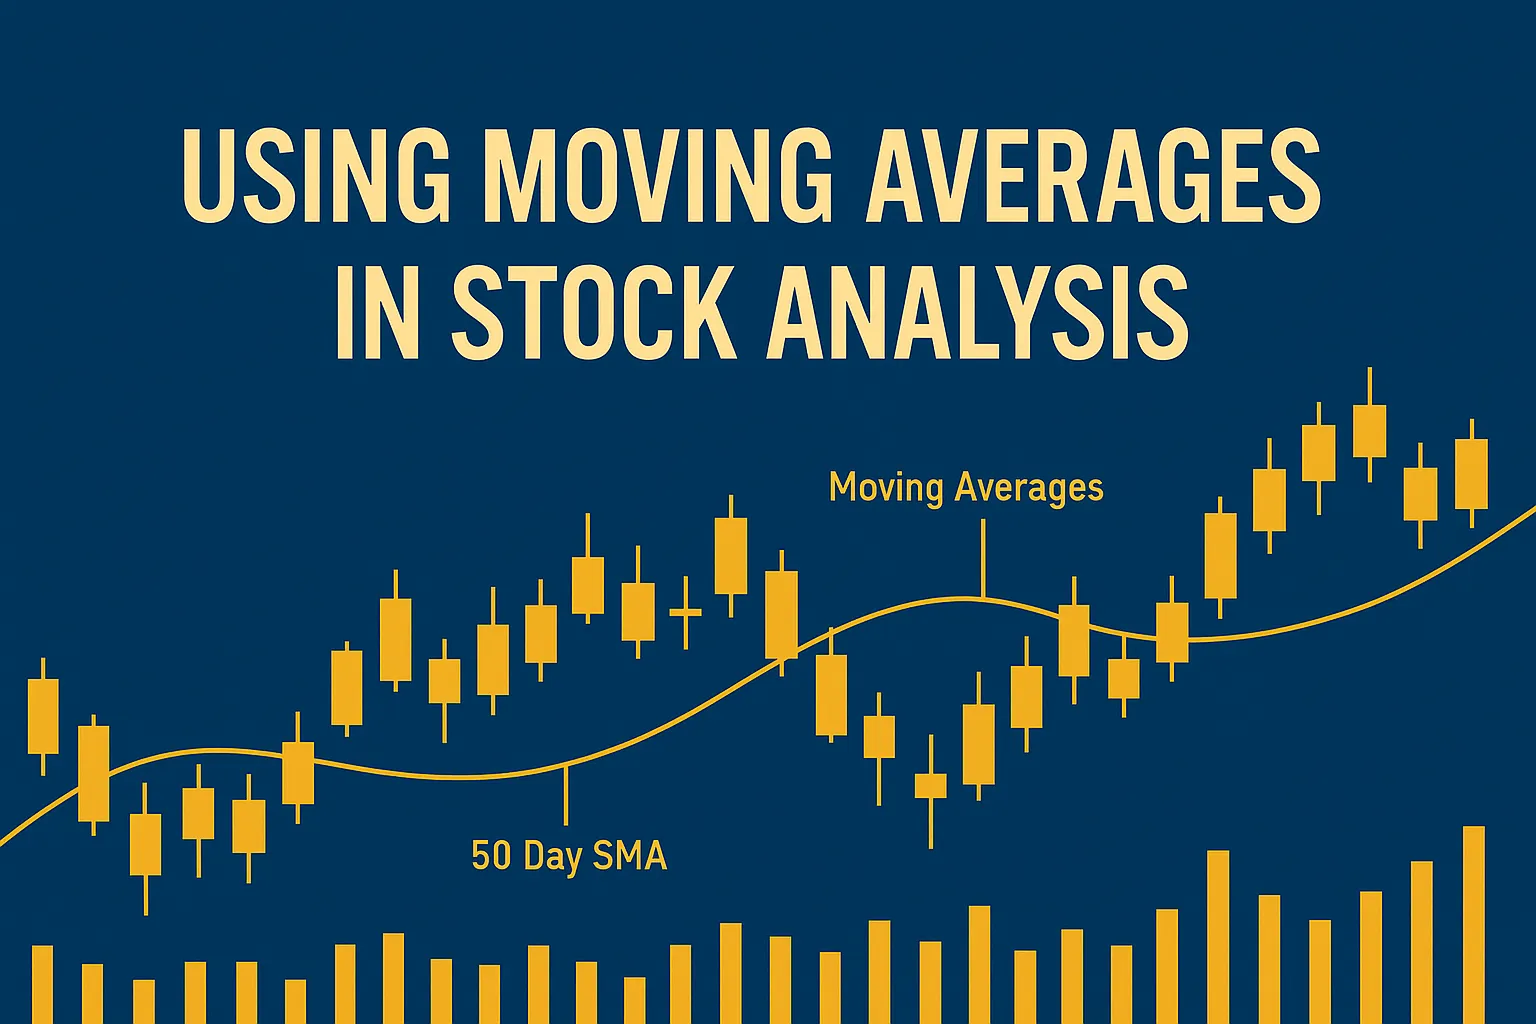
A moving average (MA) is a technical indicator that shows the average price of a stock over a specific period of time. It “moves” as new data becomes available, helping traders observe price trends without short-term fluctuations.
Why Use Moving Averages in Stock Analysis?
- Trend Identification: Quickly spot if a stock is in an uptrend or downtrend.
- Support & Resistance: MAs often act as dynamic support/resistance levels.
- Entry & Exit Signals: Crossovers can signal when to buy or sell.
- Price Smoothing: Reduces market noise to make trends more visible.
Types of Moving Averages
1. Simple Moving Average (SMA)
- Equal weighting to all prices in the time period.
- Best for longer-term trend identification.
- Common: 50-day SMA, 200-day SMA
2. Exponential Moving Average (EMA)
- More weight to recent prices; reacts faster to price changes.
- Useful for short-term trading signals.
- Common: 9-day EMA, 21-day EMA
Common Moving Average Strategies
1. Golden Cross
- 50-day SMA crosses above 200-day SMA.
- Signals potential long-term uptrend.
2. Death Cross
- 50-day SMA crosses below 200-day SMA.
- Indicates potential long-term downtrend.
3. Moving Average Crossover
- Short-term MA (e.g., 10-day) crosses a longer-term MA (e.g., 50-day).
- Common in swing and momentum trading strategies.
4. Price Above/Below MA
- Price rising above a key MA may signal a breakout.
- Price dropping below could indicate a trend reversal.
Best Moving Average Settings
| Strategy Type | Short-Term MA | Long-Term MA |
|---|---|---|
| Intraday | 9 EMA | 21 EMA |
| Swing Trading | 10 SMA | 50 SMA |
| Long-Term | 50 SMA | 200 SMA |
Tip: Always backtest settings based on your trading timeframe.
Limitations of Moving Averages
- Lagging Indicator: MAs use past data and may signal trends after they begin.
- Whipsaws: In sideways markets, they can give false signals.
- Not Predictive: Moving averages don’t forecast future prices—they smooth historical ones.
Combining with Other Indicators
To improve accuracy, combine moving averages with:
- RSI (to confirm overbought/oversold conditions)
- MACD (for trend momentum)
- Volume (to validate breakouts)
Conclusion
Moving averages are simple but powerful tools in any trader’s technical toolkit. They help reveal trends, define trade signals, and act as key decision points. Whether you’re analyzing a daily chart or monitoring intraday price movements, moving averages offer clarity and structure in a noisy market.
Start by testing the most common settings, and adapt them to your trading style.
FAQs
1. What’s better: SMA or EMA?
EMAs respond faster to price changes, while SMAs are smoother and better for long-term analysis.
2. What are the best moving averages for beginners?
Start with 50-day and 200-day SMAs to understand major trends.
3. Can I use moving averages for day trading?
Yes. Intraday traders often use 9-EMA and 21-EMA on 5 or 15-minute charts.
4. Do moving averages work alone?
They work best when combined with other indicators and price action.
5. How do I avoid false signals from moving averages?
Avoid using them during low-volatility or sideways markets. Use confirmation tools like volume or RSI.