How to Do Technical Analysis for Swing Trading
Swing trading is all about capturing short- to medium-term price movements, typically over a few days to a few weeks. To succeed, traders need more than just instincts—they need technical analysis. In this guide, you’ll learn how to perform effective technical analysis tailored specifically for swing trading.
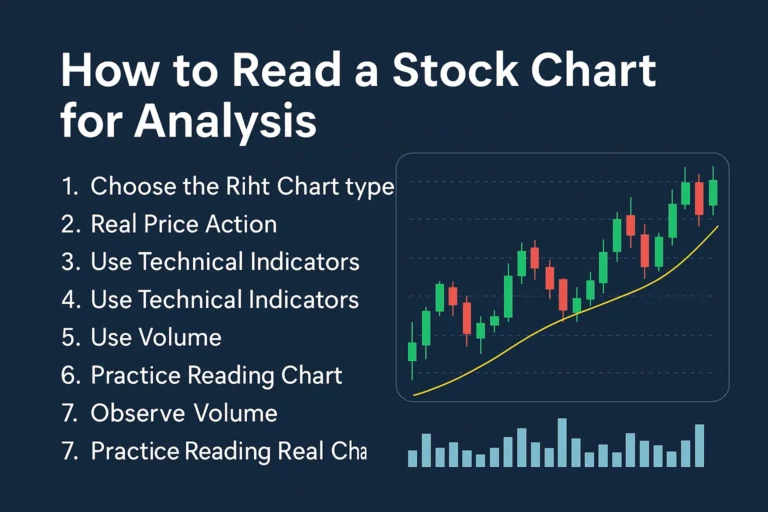
What Is Technical Analysis in Swing Trading?
Technical analysis involves studying price charts and market data to forecast future price movements. Swing traders use it to:
- Identify trends and reversals
- Spot high-probability entry and exit points
- Manage risk with stop-loss and take-profit levels
Unlike long-term investors, swing traders rely heavily on short- to mid-term price action and indicators.
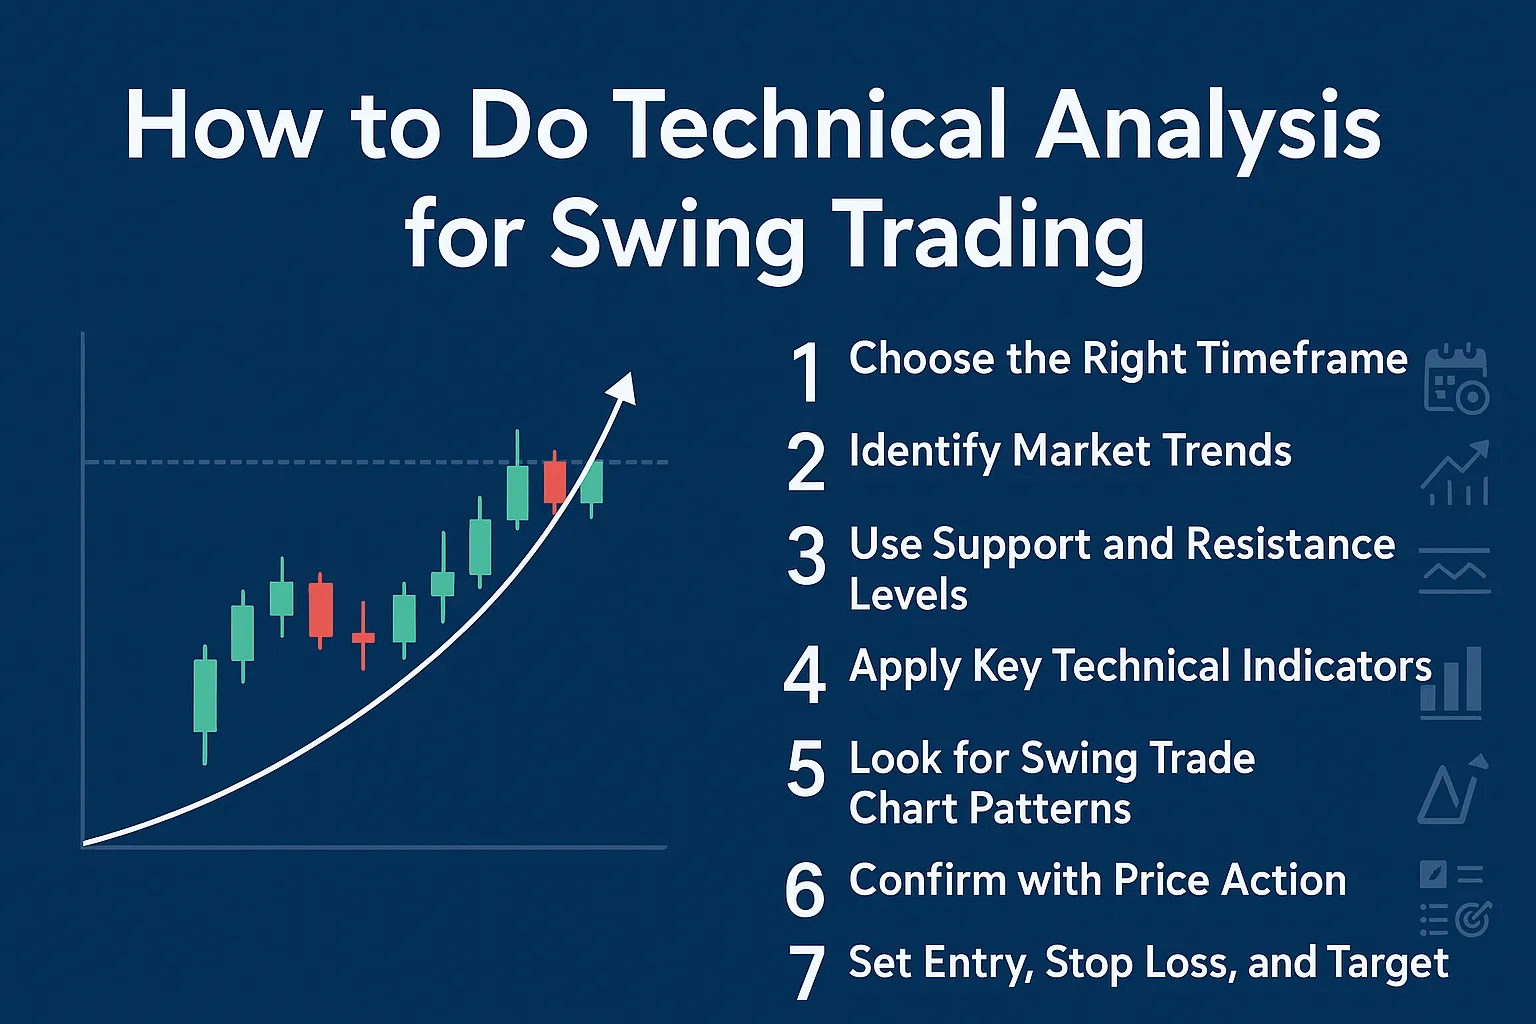
Step-by-Step Technical Analysis Process for Swing Traders
1. Choose the Right Timeframe
Swing traders usually focus on:
- 4-hour charts for precise entries
- Daily charts for trend confirmation
- Weekly charts for broader context
Timeframe alignment is key for consistency.
2. Identify Market Trends
Use tools like:
- Trendlines to visualize price direction
- Moving Averages (50-day and 200-day) to identify trend strength
- Higher highs & higher lows to confirm an uptrend
Never trade against a strong trend unless there’s clear reversal confirmation.
3. Use Support and Resistance Levels
Mark key horizontal zones:
- Support: Price tends to bounce up
- Resistance: Price tends to reverse down
These zones help you plan entries, stop-losses, and profit targets.
4. Apply Key Technical Indicators
The most effective indicators for swing trading include:
- Relative Strength Index (RSI)
Identifies overbought/oversold conditions - MACD (Moving Average Convergence Divergence)
Confirms trend direction and momentum - Bollinger Bands
Shows volatility and potential breakout setups - Volume
Helps confirm the strength of breakouts or reversals
Use indicators in combination, not in isolation.
5. Look for Swing Trade Chart Patterns
Common chart patterns used in swing trading:
- Flags and Pennants: Short-term consolidation before continuation
- Head and Shoulders: Trend reversal pattern
- Double Top / Double Bottom: Key reversal indicators
- Triangles: Setup for potential breakout trades
Always wait for breakout confirmation before entering.
6. Confirm with Price Action
Price action tells the real story. Look for:
- Rejection wicks or pin bars
- Bullish or bearish engulfing candles
- Inside bar breakouts
Price behavior at key levels adds confidence to your trades.
7. Set Entry, Stop Loss, and Target
A technical setup is incomplete without a trading plan:
- Entry: After breakout or retest confirmation
- Stop Loss: Just below support (for long trades) or above resistance (for shorts)
- Take Profit: Based on risk-reward ratio (minimum 2:1 is ideal)
8. Track and Review Your Trades
Always keep a trading journal:
- Document entry/exit, reasons, outcome
- Analyze wins and losses
- Improve future setups based on real results
Successful swing traders continuously refine their strategies.
Conclusion
Technical analysis is the foundation of swing trading success. By combining tools like trendlines, indicators, and chart patterns with disciplined risk management, you can consistently find and execute high-quality swing trades.
Start small, practice with demo accounts if needed, and refine your skills over time. The more you follow a structured approach, the better your results will be.
FAQs
1. What is the best chart timeframe for swing trading?
Daily charts are best for identifying trends, while 4-hour charts help with timing entries.
2. Which indicators work best for swing trading?
RSI, MACD, Bollinger Bands, and Moving Averages are the most commonly used.
3. Is price action better than indicators?
Price action is more reliable near key levels. Indicators help confirm setups but shouldn’t be used alone.
4. How many trades should I take as a swing trader?
Quality over quantity. 3–5 high-probability setups per week is ideal for most swing traders.
5. Can beginners use technical analysis for swing trading?
Yes. With proper education and practice, beginners can effectively use technical analysis to swing trade.